How to make animated gifs from Matplotlib plots easily
Mon, May 14, 2018Edit: There is now a much better and simpler way of creating gifs, a libray called “gif”
The problem
If you Google how to make an animated Matplotlib graph, you end up with code like that:
fig, ax = plt.subplots()

x = np.arange(0, 2*np.pi, 0.01)
line, = ax.plot(x, np.sin(x))

def animate(i):
    line.set_ydata(np.sin(x + i/10.0))  # update the data
    return line,

# Init only required for blitting to give a clean slate.
def init():
    line.set_ydata(np.ma.array(x, mask=True))
    return line,

ani = animation.FuncAnimation(fig, animate, np.arange(1, 200), init_func=init, interval=25, blit=True)
The logic of using an init function and methods such as set_ydata is a bit too complex for my taste, so I ended up using a different approach
The simple solution
The idea is to build an array of images and to convert it to a gif. To do so you need Imageio.
import matplotlib
import matplotlib.pyplot as plt
import numpy as np
import imageio

def plot_for_offset(power, y_max):
    # Data for plotting
    t = np.arange(0.0, 100, 1)
    s = t**power

    fig, ax = plt.subplots(figsize=(10,5))
    ax.plot(t, s)
    ax.grid()
    ax.set(xlabel='X', ylabel='x^{}'.format(power),
           title='Powers of x')

    # IMPORTANT ANIMATION CODE HERE
    # Used to keep the limits constant
    ax.set_ylim(0, y_max)

    # Used to return the plot as an image rray
    fig.canvas.draw()       # draw the canvas, cache the renderer
    image = np.frombuffer(fig.canvas.tostring_rgb(), dtype='uint8')
    image  = image.reshape(fig.canvas.get_width_height()[::-1] + (3,))

    return image

kwargs_write = {'fps':1.0, 'quantizer':'nq'}
imageio.mimsave('./powers.gif', [plot_for_offset(i/4, 100) for i in range(10)], fps=1)
Result
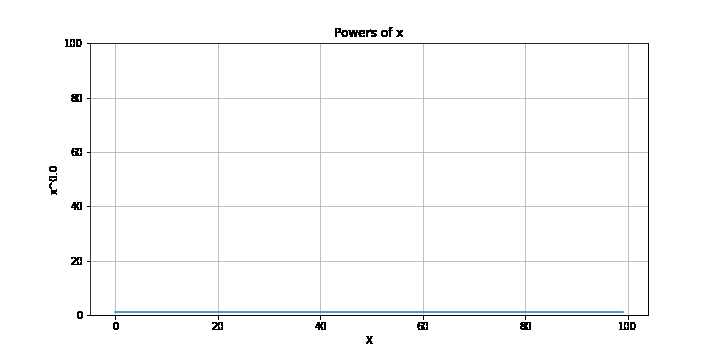
Result of the code above